Research Interests - Gas Sensors
 |
|
|
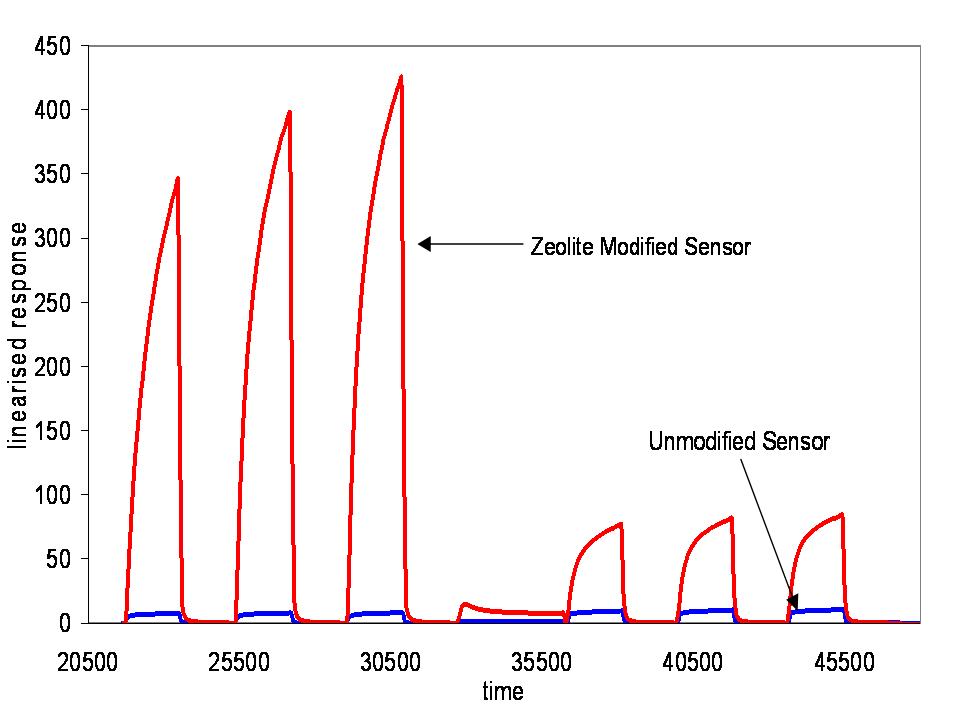
Figure 5. Gas response to ethanol of Zeolite Modified CTO Sensor and Unmodified CTO Sensor at different gas concentrations. The blue line corresponds to an unmodified sensor response to ethanol gas, the red line corresponds to a modified sensor on exposure to the same concentration of ethanol gas. the difference in response is very large - two orders of magnitude. The zeolite modification allows this as the zeolite reacts with the ethanol to turn it into something the sensor material is more sensitive to. Therefore, by understanding the chemistry that occurs in the zeolite it is possible to design and build a sensor tailored towards a particular gas and task - overcoming the selectivity problems associated with metal oxide semi-conductor devices. |
|